
| MULTIUSER
BENCHMARKING USING REMOTE TERMINAL EMULATION |
| Originally published March, 1995 |
| by
Carlo Kopp |
| © 1995, 2005 Carlo Kopp |
|
Benchmarking has traditionally been an area of much controversy, both in the technical community and user base. The sad reality is that much of the established benchmarking methodology is only of limited usefulness, and unless the user of the benchmark results understands the limitations of the benchmark in use, the results can be quite misleading. The central idea behind any benchmark is that of providing a common metric for comparison between between various pieces of equipment, in most instances computer systems. A good benchmark is one which provides thorough test of system performance in relation to the user's application and operational environment. Where the benchmark has little in common with the way the system will be loaded, it is for all practical purposes irrelevant. The most common benchmarks which a user will encounter are synthetic benchmarks, where a program or suite of programs is run on the target system (or SUT - System Under Test for those in the benchmarking trade). Assuming the benchmark code is identical for all tested systems being evaluated, what the benchmark will indicate is some ratio of performance across the range of evaluated systems. If and only if the benchmark is very close in behaviour to the user's application, will the results be useful. Defeating benchmarks is favourite pastime in the technical community, particularly where there are sales to be gained. Designers of machines, as well as writers of operating system code and compilers will very often use synthetic benchmarks as tuning and testing tools for their products. This is both good and bad, subject to one's perspective on the matter. Where the benchmark is relevant to the user's application, significant gains can be made as the product design will be biased to enhance those performance characteristics which the benchmark loads most thoroughly. Unfortunately, where the benchmark diverges from real world requirements,its use as a development support tool will lead to unbalanced system design and performance bottlenecks which may severely impact the system's capability in key areas. A good example is the popular Specmark series of tests, devised for engineering and scientific workstations. The Specmark involves running a suite of tests, and producing both test specific scores, as well as total weighted sum scores. Done properly, a Specmark provides a well balanced metric of performance in the single user operating environment. The use of Specmarks has seen manufacturers increase cache sizes, bus bandwidths, CPU throughput and disk I/O performance, all key aspects of system performance in a typical workstation environment. What a Specmark doesn't indicate particularly well is interprocess communications (IPC) performance, critical in a networked environment, and performance in other key areas such as NFS and network interface throughput. As many workstations are used as local servers, or support Xterminals, Specmark results may or may not be very useful in reaching a decision on what to choose. Multiuser performance, particularly when running database or business applications, is a very different kettle of fish, which loads the tested system in very different ways. Synthetic benchmarks, such as the TPC series, have been a very popular metric for sizing machines used for such commercial applications. As with workstation benchmarks, a synthetic database benchmark will execute a large number of artificial operations (transactions) against a synthetic database, and provide some figure to indicate the transaction rate in transactions per second or per minute. Synthetic database benchmarks have proven in practice to provide far less useful results than engineering/scientific benchmarks. This is for a number of good reasons.
Another grey area of significant importance, where benchmarks are produced by the equipment manufacturer, is system tuning. Vendors have a vested interest in selling their products, and in many instances will go to great lengths to tune the operating system used for a synthetic benchmark to achieve the best possible performance for the test. Such tuning will often also involve the use of third party compiler products, which are not the standard kit issued with the off-the-shelf product. Superior compilers can make a big difference in CPU performance, and this can in turn lead to a significant divergence between a test result produced with standard kit, versus the crafted benchmark result. The author has seen a number of instances over the years, where a highly tuned system and better compiler yielded substantially better performance, so much so that attempts to replicate the result with the standard product fell very much short of the official figure. A site wishing to select a commercial host system thus stands little chance of unravelling the intricacies of a range of synthetic benchmarks carried out by a range of vendors. There are simply too many variables in the equation to be able to accurately relate differences between machines which are in most instances very close to one other in terms of real world performance. Sizing a host from synthetic benchmark results, in relation to a site specific application, is an equally impossible task. Again there are too many variables to contend which, and some can dramatically influence performance. The solution to this dilemma is the use of Remote Terminal Emulation benchmarking, a technique which has grown in use over the last decade. Remote Terminal Emulation The RTE methodology is based upon the idea of using the actual target application on the tested system, and using a second host system to simulate real world users logging in and running the application (a direct analogy to the engineering method of stimulating a tested system with a signal generator). Because the RTE method uses the user application and all of the system's services, it can replicate quite accurately the load experienced in a production environment, avoiding the pitfalls of synthetic multiuser benchmarks. Instead of taking a building full of real physical users and having them repetitively carry out transactions from their keyboards, the RTE method replaces each user with a simulated user executed on a driver host. Each user is replaced with a process, which executes a script of keystrokes, which are transmitted across a network to the target system. Since the target (tested system) cannot distinguish a human being thumping a keyboard on a dumb terminal wired to a terminal server, from a synthetic user executing on another host platform, this method can faithfully reproduce real world host loading. An RTE benchmark is thus the most accurate benchmarking method in existence today, for multiuser system benchmarking. Implementing an RTE benchmark is not a trivial exercise technically, as we will further see. The starting point in any RTE benchmark is producing command scripts for individual user sessions. The objective is to produce a series of keystrokes which correspond to a real user carrying out a specific transaction type or series of transactions, when running the application. A typical command script will be a series of keystrokes via which the notional user navigates his/her way through the application's screens, and if required, also includes data entries and keystrokes to commit the transaction. In practice, implementors of command scripts will identify typical transaction types for the system, and produce several generic queries or transactions which are characteristic of production usage. Good RTE products will provide facilities which enable the script to insert randomly selected names or numbers into the script, thus emulating real world access patterns against the database. This is significant when dealing with products which have clever internal caching schemes. While the command script is essential, using it alone to emulate the user-to-application functional loop is inadequate. This is because real world applications may exhibit non-deterministic behaviour in their screen responses. A typical instance is where two users attempt access to the same record, whoever gets there last finds a locked record and will in most instances be asked by the application to retry. If the emulation blindly fires keystrokes at the user application, the script must essentially fail. The resolution to this problem is the use of the thread model. In the thread model, each keystroke or series of keystrokes is paired with an expected screen response, and the emulation process and application session are synchronised. Only if a keystroke is responded to by the proper screen response and thus synchronisation is maintained, will the next keystroke be sent. Screen responses are typically identified by unique escape and control sequences fired by the user application at the user's terminal. The thread model is a very powerful addition to the basic remote terminal emulation scripting method, because it allows the RTE package to model the application's behaviour both in time and in type of response. As we will further see, this allows other uses than simply performance testing. In practice, a good RTE package will provide facilities to record a user session and automatically extract the screen response escape sequences, and time delays. These will usually be converted into a scripting language or in some products, C source code ready for compilation. Until now, we have looked closely at a single thread of user activity. To be practically useful, the RTE system in use must allow for the concurrent running of a large number of emulated users, and all importantly the logging of results. This presents some interesting challenges, particularly if the test involves 500, 1000 or more users. Each and every user must be managed, their "progress" through the thread monitored, and all events logged. As with most systems software, there are a multiplicity of solutions available to the problem. The logging of events, such as response times to user keystrokes, is most easily accomplished by having each user emulation process write to its private logfile, as this avoids problems with pre-emption and locking of shared structures. After the test is completed, a program or script can be used to extract the required statistics from the collection of logfiles. Management of a thousand or more processes is a trickier proposition. While Unix provides a range of interprocess communications (IPC) schemes, in practical situations shared memory has proven to the most useful approach, as it shifts much of the processing burden upon the user emulation processes, rather than the operating system. Overburdening the operating system of the driver system with IPC traffic can fall foul of the host system's limitations and affect performance thus invalidating the benchmark results. A typical RTE product will therefore use a single management process or daemon which sits in the background and monitors the status of each "user" by accessing the shared memory structures. Commands to start, stop, continue and finish activity are also issued via shared memory structures. The use of slower IPC methods such as pipes or message queues is possible, but imposes as discussed above performance limits. A benchmark or performance test will then involve a system operator commanding the management daemon to fork off all of the user processes, and then command them to start executing their threads of activity. Once the required time has elapsed, the processes are shut down, one by one, and finally the daemon is killed. The operator can then run postprocessing tools to extract statistics from the collected logfiles. While the process is quite simple conceptually, there is a vast amount of technical detail hidden within the innards of the machinery, as well as in the preparation of the test, and postprocessing and interpretation of results. All of these we will now examine in more detail. Test Preparation The first phase in any RTE benchmark is defining the level and type of user activity to be simulated. With existing production systems which are to be migrated to different or larger host systems, the problem is somewhat simpler than sizing for an unknown or projected system. In both instances it is necessary to define events and event rates. An event is in this instance a transaction or query of interest, such as a search for a particular type of record or an update to the database involving a commit operation. Where a production system exists and logs its operations, events and event rates can be extracted from logfiles. Essentially we are trying to establish how frequently a particular event occurs in the real world, and what statistical properties the accesses have. Interestingly enough, classical communications engineering aids us in this pursuit, and we use the well established Markovian telephone system access model, based upon the Poisson distribution which we should all remember from our undergraduate Maths courses. It turns out that most commercial operators make accesses in response to telephone queries, and not surprisingly all the statistics the author has ever extracted have invariably exhibited Poisson statistics (if anybody has had the pleasure of finding a user base exhibiting different statistical properties, the author would love to see them !). Analysis of production logfiles should ultimately yield an average event rate or frequency of arrival for each type of transaction against the database, and the fraction of the total users on the system which are running each application or part of the application. The end result is therefore a table which says that N users are running application A (eg lookup on a user account), M users are running application B (eg update a user account) and say P users are running application C (eg stock level enquiry). Each application is accessed with a particular frequency and is Poisson distributed. Knowing this, we can then set up the RTE product to run N processes of type A, M of type B and P of type C, each of which will generate transactions at some nominal frequencies of n, m and p transactions per minute. Interestingly enough, the author's experience in analysing production logfiles has usually indicated that the site's subjective estimates of user access frequency are overstated, often by a factor or two or more. Knowing what activities are happening at which frequencies serves as a basis for determining the parameters of the test. If upsizing is required, the numbers are simply scaled in the appropriate ratios. At this point, we can actually start producing the activity threads which will be the fodder upon which the RTE's user processes feed. Running an RTE Benchmark Whilst the running of the benchmark, outlined earlier, is conceptually straightforward, there are some interesting technical issues involved which deserve attention. The foremost of these is emulating the Poisson arrival process of user transactions. The simpleminded approach of having each "user" process run at its own pace will not yield the desired result, as those transactions which execute quickly on the test target will happen very frequently, and those which take a long time to execute, will happen infrequently. A poorly designed RTE benchmarking product which behaves this way will therefore produce unrealistic results. A nasty little problem which can crop up under such conditions is inadvertent synchronisation of user processes, during which certain transaction types end up being executed in lockstep. This will typically happen when several "users" need to access a shared record, and end up queuing for the resource. After several such cycles the aforementioned scheme tends to fall into a state of synchronisation and results are compromised. The proper approach is to have the user processes emulate the Poisson behaviour by using suitably random timers. After a user process executes a transaction of a given type, it sleeps for a random period of time (defined by the event rate statistics) and then executes the next transaction. if this is implemented properly, the RTE benchmark can do a very good job of simulating the ugliness of the real world. Starting and stopping benchmarks with hundreds or thousands of users presents further interesting challenges. Having 500 users trying to simultaneously log themselves into the test system is a good way of saturating the test system, leading to thrashing and in some instances, even operating system panics. Similar things happen if 500 users all try to log out at once. A well designed RTE product will therefore stagger the starting times of user threads, as well as the stopping times. The test is then divided into a "start phase", an "active phase" and a "shutdown phase". Logfile statistics are only valid during the "active phase". Once a benchmark is under way, performance statistics are gathered on the tested system. This involves running vmstat on BSD hosts, sar on System V hosts or proprietary tools on proprietary Unix hosts. The combination of system performance statistics and user response time statistics provides unambiguous measurement of the performance of the tested host system. Real world benchmarks under such conditions often involve multiple iterations, with incremental increases either in user numbers or event rates. Often the host will need to have a new kernel built, as one or another system resource limit is breached. Common instances are NPROC, NPTY or the number of open files. Under such conditions the benchmark becomes also an incremental tuning process, indeed the RTE benchmarking method is an excellent tuning tool for large systems and its use can, in the author's experience, be justified on this basis alone. Postprocessing RTE Benchmark Results Once a benchmark has been run, the logfiles may be processed to extract transaction response time statistics. Timesharing computer systems are by their very nature complex queuing systems, and the databases and applications run on such systems also exhibit queuing behaviour in many respects. Therefore it should come as no surprise that the response time statistics are also characterised by queuing behaviour. The best method for quantifying response time performance for a transaction is to timestamp the keystroke which initiates the transaction (eg query or commit) and then timestamp the arrival of the screen response. Postprocessing software tools can then calculate the real time in seconds or hundreds of milliseconds between the timestamps. If this is done for each and every transaction of a given type executed during the test, we can produce a good statistical measure of performance. It should further come as no surprise that when we histogram the frequencies of response times, we get a pretty little negative exponential curve which alas is characteristic of the Poisson process. What is also interesting is that this behaviour has been found on systems running RDBMS products (eg Oracle) as well as on large monolithic systems (eg COBOL applications). Understandably, people will always seek a single number as a metric of performance, and the number which is most practical under such circumstances is the 95% confidence interval point, or that response time at which there is a 95% probability that the response time will be equal or better (faster). A good RTE product will use its postprocessing tools to extract the 95% Confidence Interval Point and histogram it to show the distribution. These results are then evaluated in relation to the sar or vmstat statistics for the host. Feature size limits preclude a more detailed discussion of the relationships between system performance metrics such as idle time and the measured response times, suffice to say here that 30% system idle time is usually the point at which response times start to dramatically degrade. Conclusions The Remote Terminal Emulation benchmarking method, when used with proper statistical methods for test load modelling and benchmark result analysis, provides an accurate and repeatable means of quantifying the performance of a host system running a given multiuser application. Unlike synthetic benchmarks, the RTE method tests the actual application to be run, and therefore yields results which may be used for direct numerical comparison. This is particularly useful when evaluating systems for purchase, scaling existing systems for higher user loads, and verifying the capacity of an existing system to sustain a particular number of users or mix of transaction types. Sites intending to use this method for benchmarking hosts should tread carefully, as there are a number of public domain and proprietary products in the market, some of which can deal with the technical issues discussed and some which cannot. A poorly implemented product will degrade the accuracy of the test, thereby losing much of the potency inherent in the basic method. As always, it is better to thoroughly investigate before committing your budget, as you can always end up with results which are only marginally better than those produced by synthetic benchmarks. Better safe than sorry. |
|
Figure 1. Interarrival Time Histogram for Queries The first phase in preparing an RTE benchmark is that of constructing a load model to determine the rate at which a production system is queried. This plot was produced from the logfiles of a large COBOL application on a system which supported around 1000 users. The negative exponential characteristic is typical of Poisson random processes, and allows a benchmarker to set the average rate at which queries are fired at the tested system. In this instance analysis yielded an average arrival rate of 21.3 queries per hour. |
 |
|
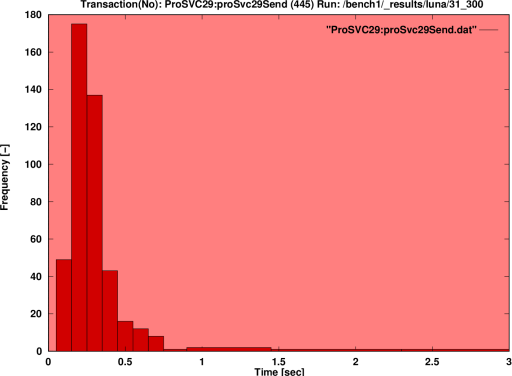
Figure 2. Query Response Histogram The end result of a well executed RTE benchmark is a histogram of query response times which displays the characteristic Poisson envelope. Large multiuser systems exhibit queuing system behaviour, and yield Poisson statistics. This is important when defining performance specifications for large databases, as it is impossible to guarantee deterministic response times. Response time performance must therefore be defined in terms of percentile confidence levels, eg a 95% confidence level that the response time for a given transaction will be equal to or below say 800 milliseconds. |
 |
|
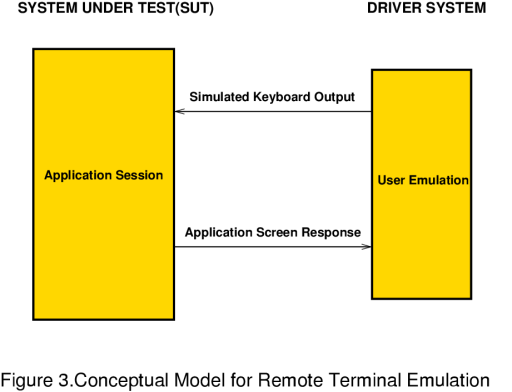
Figure 3. Conceptual Model for Remote Terminal Emulation The RTE benchmarking methodology is based upon the idea of replacing real physical users with processes which emulate the user's behaviour when accessing an application. The user emulation process fires characters at the application, simulating keystrokes, and interprets the screen response by synchronising itself to specific terminal escape sequences, which are unique to the expected screen response. |
 |
|
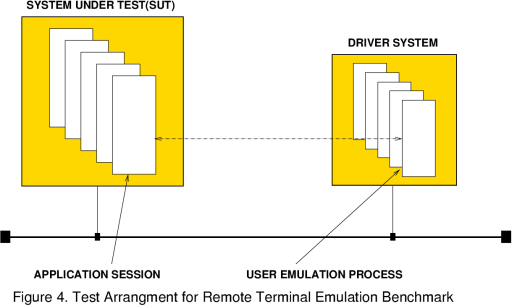
Figure 4. Test Arrangement for RTE Benchmarking The basic test arrangement for an RTE benchmark involves a test system, running the user's application(s), and a driver system, which runs the user emulation processes. Driver machines are typically sized to 30% of the size of the tested system. Network connections may use telnet or rlogin. |
| $Revision: 1.1 $ |
| Last Updated: Sun Apr 24 21:21:24 GMT 2005 |
| Artwork and text © 2005 Carlo Kopp |