Some Observations on Digital
vs Wet Film Photography
|
|
Dr Carlo
Kopp, MIEEE, SMAIAA, PEng
Text, Images © 2010, Carlo Kopp
|
|
|
A
question
which
is
frequently
asked
is
whether
digital
cameras
produce
“better” images than film cameras
and scanners. This is a somewhat vexed question, given the enormous
differences between various digital and film cameras, in terms of lens
performance, CCD/CMOS array noise versus film emulsion grain
performance, anti-aliasing and demosaicking algorithm performance, and
specific lighting conditions on the day.
The usual argument then often distills down “what number of Megapixels
in a scan of a film frame is equivalent to what number of Megapixels in
a digital camera image?”; assuming of course all else being “equal”.
This question is more easily answered, as it is a straightforward
application of Nyquist's sampling theorem.
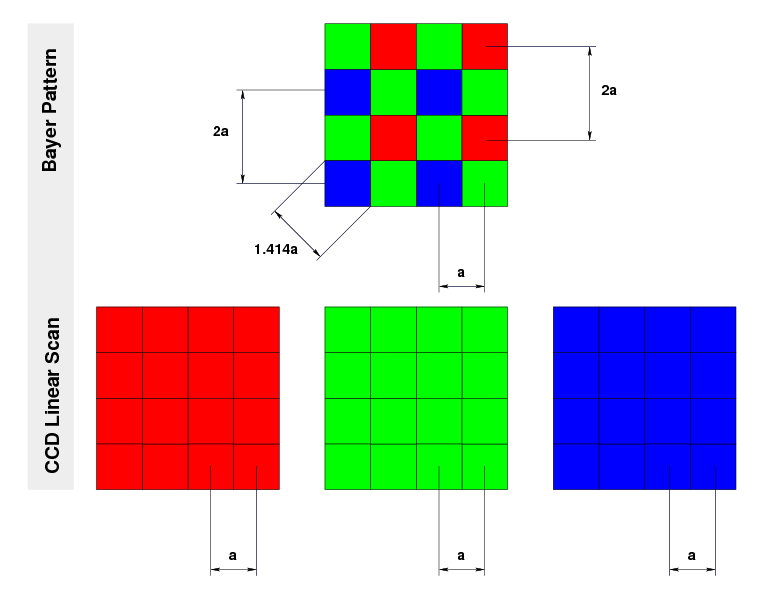
Most digital cameras employ Bayer pattern technology to separate red,
green and blue channels. The Bayer pattern is a clever way
of cheating on imaging array complexity, by exploiting the limitations
of the typical human eye, which can resolve objects more sharply in
monochrome, compared to the red, green and blue bands, yet the eye is
typically most colour sensitive in the green band.
If we assume that the spacing between pixels is geometrically equal,
and of value a, then in a
typical linear CCD scanner used to digitise slides or negatives, each
pixel is imaged in the red, green, and blue bands, and the highest
spatial frequency in the image which can be captured without aliasing
is exactly one half of the spatial frequency determined by the spacing
between pixels, a.
Let us now consider the Bayer pattern CCD/CMOS chip. If this chip has
an equal spacing between pixels, then if it images in the green band,
the shortest distance between pixels is 1.414 x or sqrt(2)
x a. This
sets a hard limit in turn on the spatial frequency the chip can image,
to one half of the spatial frequency determined by the spacing between
pixels, 1.414 x a.
Applying
the same argument to the red and blue channels, yields 2 x a.
What does this mean in terms of “Megapixels”?
When
people
describe
imaging
performance
in
Megapixels,
it
is
a
measure
of sampling density across an area, so assuming equal or similar
aspect ratios in image frames, we simply square the representative
ratios. The aim is to find how many more Megapixels does a Bayer
pattern CCD/CMOS chip need compared to a film scanner, to achieve the
same spatial frequency and thus image sharpness. The same argument,
incidently, can also be applied to comparisons between imaging site
(pixel) density in the Foveon technology CCDs.
The green channel determines the ultimate limits in image sharpness for
the Bayer pattern CCD/CMOS chip, which must have in
this ideal case
twice as many Megapixels compared to a good quality scan of a wet film
frame. If the scene being imaged has large areas of finely textured red
or blue colour, then resolution in the red or blue bands becomes a
quality factor. In both the red and blue channels, the
Bayer pattern CCD/CMOS chip needs four times the number of Megapixels
required by the scanner.
This limitation of the Bayer pattern is typically prominent where the
image contains large areas of highly saturated blue or red. Where all
red or blue areas in the image have low saturation, or areas have other
colours with substantial green spectral content, then software in the
camera can be employed to interpolate, and use all three colours to
achieve nominal Megapixel resolution.
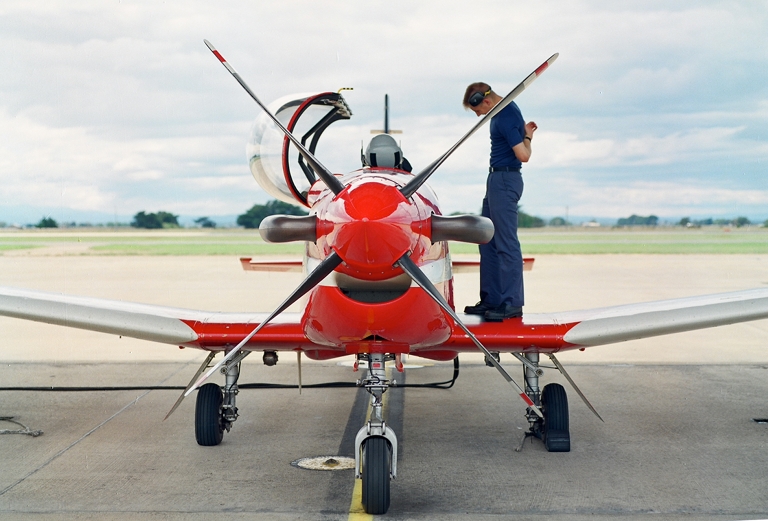
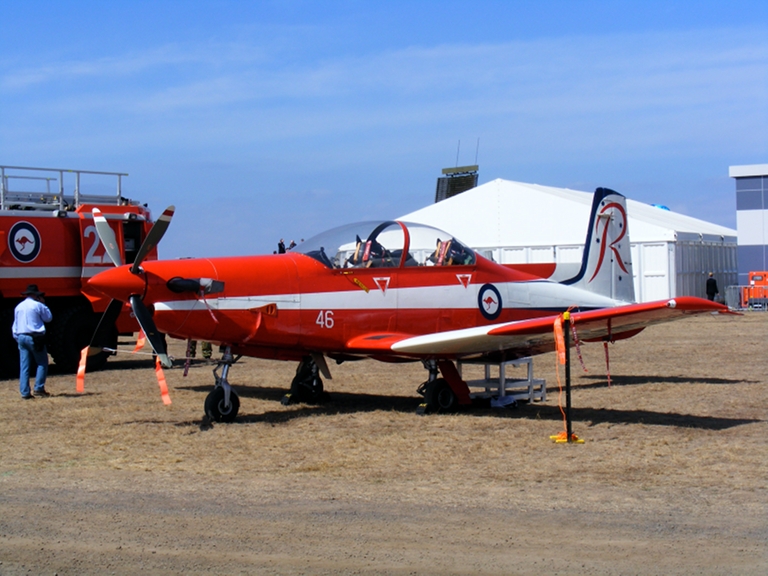
Four sample images of PC-9/A aircraft at the bottom
of this page provide a good example. The images produced by the digital
cameras are very good, but lack the fine texture in the smoothly curved
and polished red areas which are well captured by the Noritsu HS-1800
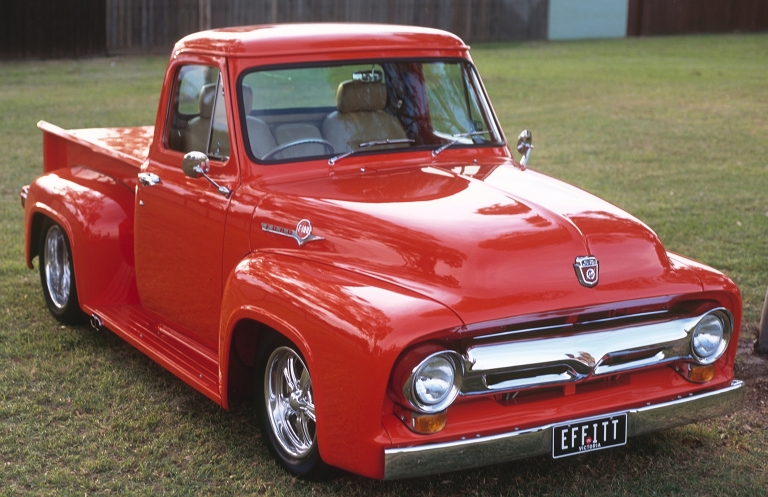
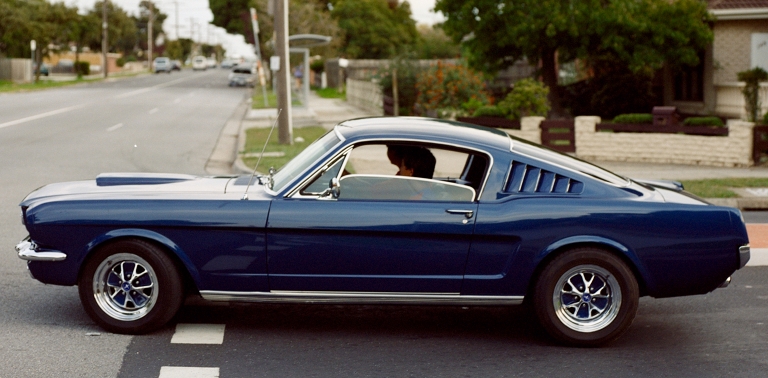
scanner off the 120 format film. The fifth and sixth images of cars,
scanned by a Fuji Frontier SP-3000, show similar behaviour. This effect
is a direct result of the fine surface texture and spectral composition
of the reflection.
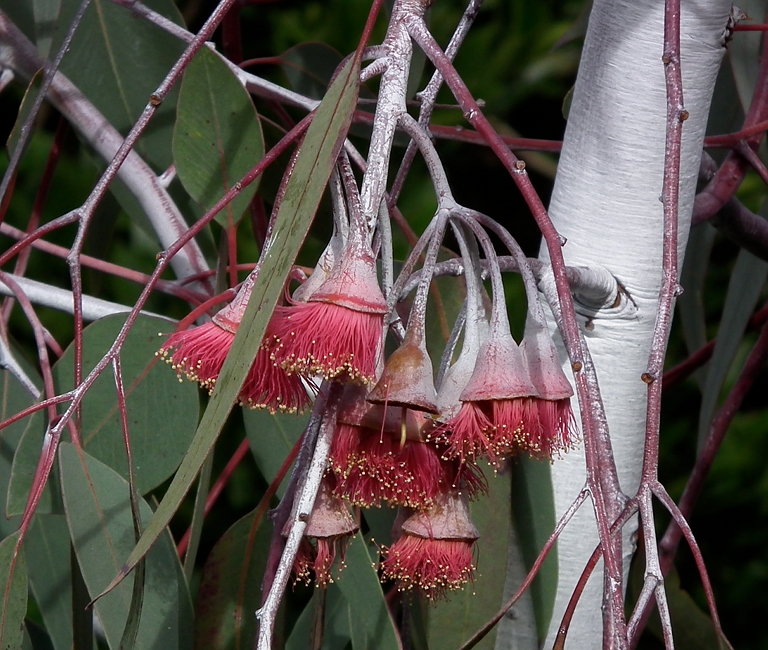
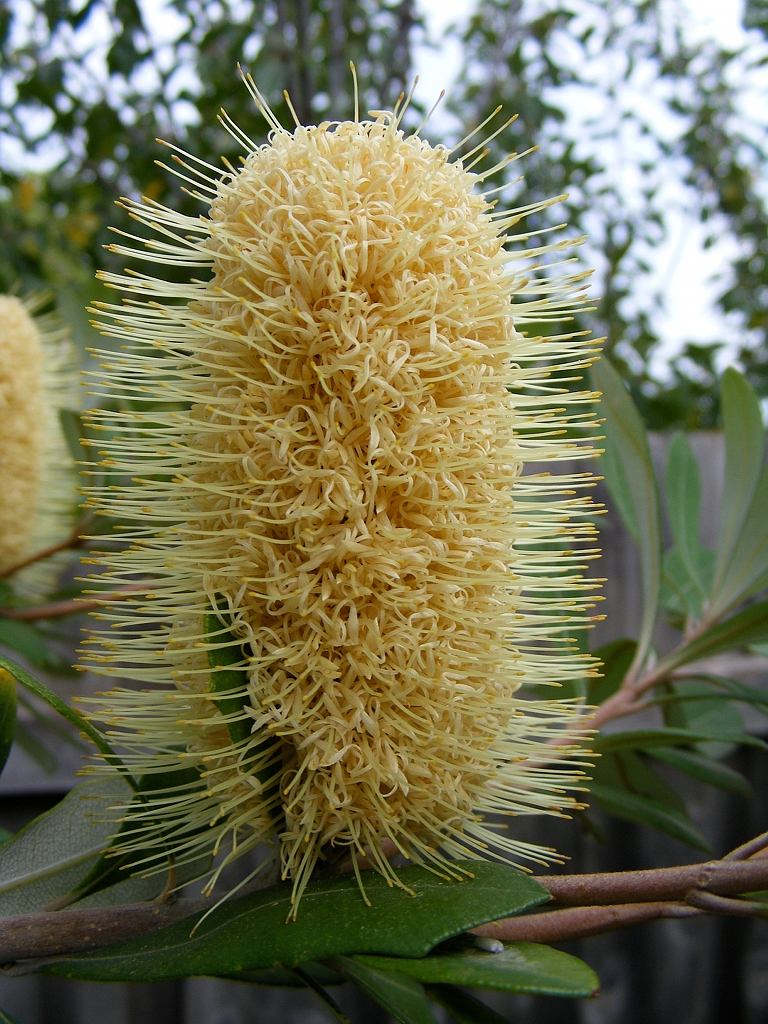
For comparison, the two images of foliage, dominated by green and
yellow tones, are exceptionally sharp and well textured. Put simply,
the Bayer pattern likes images with strong green content.
Prima facie this suggests that it is not yet time to throw away your
wet film camera, especially if it is a high quality medium format
design. But
theoretical imaging resolution is not the whole story.
Modern digital cameras have often sophisticated autofocus mechanisms,
and often very smart aperture/shutter control algorithms. Moreover,
good DSLRs or superzooms have multiple image stabilisation mechanisms
to compensate for fine jitter. Many digital cameras include sharpening
algorithms. These features are typically absent in film cameras, and
the result are often photographer-induced defects in exposure,
field of focus and fine jitter.
Film grain is another impediment to high quality in wet film images.
Many films which on paper have respectably low RMS grain size are
disappointing in practice. While the RMS grain value may be low, the
statistical properties of the grain may still be such, that grain will
be present at sizes comparable to a pixel and impair the image.
While noise produces a similar impediment in CCD/CMOS imaging chips, it
is generally less prominent than film grain, and also can be better
managed by the design of the imaging sensor.
A factor often ignored in marketing literature is the physical
size of the pixels in a CCD or CMOS imaging chip. At a constant chip
size, increasing the number of pixels reduces the area of each pixel,
in turn reducing the number of photons it can capture. Less photons
captured in turn means lower Signal / Noise Ratio (SNR) and thus
noisier image. Typically lenses are designed for some imaging area, be
it chip or film, and this sets contraints, as does the manufacturing
yield of the imaging chip. Excessive noise can degrade a digital image
just as effectively as grain can degrade a film image.
In conclusion, digital imaging technology using CCD or CMOS imagers
will outperform scanned film, but only if the imaging device has a
sufficent pixel count.
|
|
|
|
Example 39
Megapixel image (Joseph Holmes,
2009)
produced
with
a
Phase
One P45+ digital back, Mamiya 645AFDII, 55
-110 mm f4.5 lens at 80 mm, ISO 50, 1/60: Crater
Lake
39
MP
Emil Martinec, Noise,
Dynamic
Range
and
Bit
Depth in Digital SLRs, Enrico Fermi
Institute, University of Chicago.
Camera
Sensor rankings with DxOMark
|
|
|
|
|
135 / 35 mm Slide Scan Resolutions
|
36 mm x 24 mm = 1.417
in.
x
0.945 in.
|
PPI
|
Width
|
Height
|
Line
Scan
Resolution
[MP]
|
Bayer Green [MP]
|
Bayer Red/Blue [MP] |
Pixel
[μm]
|
1200
|
1700
|
1134
|
1.9
|
3.9
|
7.8
|
21.1
|
1700
|
2400
|
1600
|
3.8
|
7.7
|
15.4
|
14.9
|
2000
|
2649
|
1776
|
4.7
|
9.4
|
18.8
|
12.7
|
2170
|
3075
|
2027
|
6.2
|
12.4
|
24.8
|
11.7
|
2400
|
3400
|
2268
|
7.7
|
15.4
|
30.8
|
10.6
|
| 2550 |
3613
|
2409
|
8.7
|
17.4
|
34.8
|
10.0
|
2730
|
3873
|
2581
|
10.0
|
20.0
|
40.0
|
9.3
|
3000
|
4251
|
2835
|
12.1
|
24.2
|
48.4
|
8.5
|
3200
|
4534
|
3024
|
13.7
|
27.4
|
54.8
|
7.9
|
3600
|
5101
|
3402
|
17.3
|
34.6
|
69.2
|
7.1
|
4000
|
5668
|
3780
|
21.4
|
42.8
|
85.6
|
6.4
|
6000
|
8502
|
5670
|
48.2
|
96.4
|
192.8
|
4.2
|
|
120 / 220 / 6 x 4.5 cm
Slide Scan
Resolutions
|
| 56 mm x 45 mm = 2.36
in.
x
1.77
in. |
PPI
|
Width |
Height |
Line
Scan Resolution
[MP] |
Bayer Green [MP] |
Bayer Red/Blue [MP] |
Pixel
[μm] |
600
|
1416
|
1062
|
1.5
|
3.0
|
6.0
|
42.3
|
700
|
1652
|
1239
|
2.1
|
4.2
|
8.4
|
36.3
|
800
|
1888
|
1416
|
2.7
|
5.3
|
10.6
|
31.8
|
1185
|
2796
|
2048
|
5.7
|
11.4
|
22.8
|
21.4
|
1200
|
2832
|
2124
|
6.0
|
12.0
|
24.0
|
21.1 |
1300
|
3068
|
2301
|
7.1
|
14.2
|
28.4
|
19.5
|
1460
|
3441
|
2539
|
8.7
|
17.4
|
34.8
|
17.4
|
1550
|
3658
|
2744
|
10.0
|
20.0
|
40.0
|
16.4
|
1700
|
4012
|
3009
|
12.1
|
24.2
|
48.2
|
14.9
|
2000
|
4720
|
3540
|
16.7
|
33.4
|
66.8
|
12.7
|
2400
|
5664
|
4248
|
24.1
|
48.2
|
96.4
|
10.6 |
| 3000 |
7080
|
5310
|
37.6
|
75.2
|
150.4
|
8.5 |
3077
|
7264
|
5440
|
39.5
|
79.0
|
158.0
|
8.3
|
3600
|
8496
|
6372
|
54.1
|
108.2
|
216.4
|
7.1 |
4000
|
9440
|
7080
|
66.8
|
133.6
|
267.2
|
6.4
|
| 6000 |
14160
|
10620
|
150.4
|
300.8
|
601.6
|
4.2 |
|
Representative
Film Resolving Power
Examples [1985 - 2010]
|
Wet
Film Type
|
Chart
Contrast
1.6:1
|
Chart
Contrast
1000:1 |
RMS
Grain
|
Notes
|
Fujifilm Velvia 50
[RVP50]
|
80
[lines/mm]
|
160
[lines/mm]
|
9 |
Reversal /
2010
|
Fujifilm Provia 100F
[RDPIII]
|
60
[lines/mm] |
140
[lines/mm] |
8 |
Reversal /
2010
|
| Fujifilm Astia 100F
[RAPF] |
60
[lines/mm] |
140
[lines/mm] |
7 |
Reversal /
2010 |
Fujifilm Pro 160C/S
|
63
[lines/mm] |
125
[lines/mm] |
3
|
2010
|
Fujifilm Pro 400H
|
50
[lines/mm] |
125
[lines/mm] |
4 |
2010 |
Fujifilm Pro 800Z
|
50
[lines/mm] |
115
[lines/mm] |
≤ 5
|
2010 |
Ektar Pro
100 [Ekt 100]
|
-
|
154
[lines/mm] |
Very
Low
|
2010 |
| Ektachrome
100G/GX |
63
[lines/mm] |
140
[lines/mm] |
8 |
Reversal
/ 2010 |
Ektachrome
64 [ER]
|
50
[lines/mm] |
125
[lines/mm] |
11 |
Reversal /
1985
|
| Kodachrome
25 [KM] |
63
[lines/mm] |
100
[lines/mm] |
9 - 11
|
Reversal /
1985
|
Sources:Fujifilm, Kodak
datasheets.
|
|
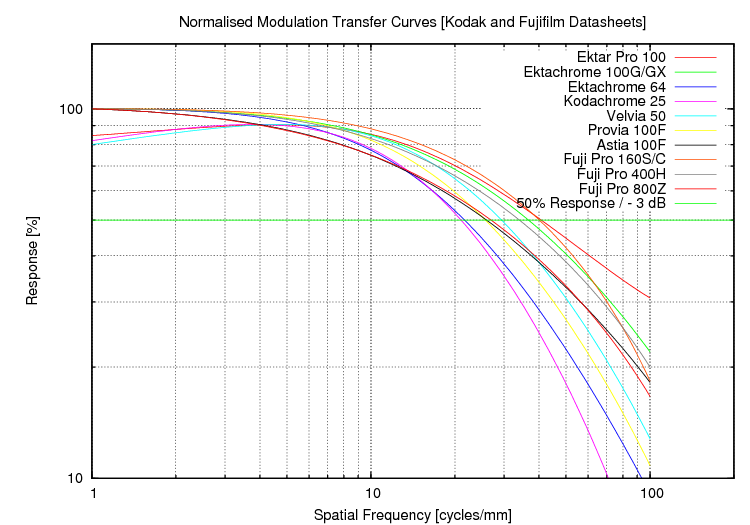
These normalised MTF curves were
produced by sampling MTF curves in Kodak and Fujifilm datasheets, and
producing a smoothed plot of these sample points, normalised to the
peak response. As the curves are shallow at the point of intersection
with the 50% MTF line, caution should be exercised in interpreting the
curves - they should be treated as indicative rather than absolute. As
neither manufacturer has disclosed tolerancing data for their published
MTF curves, actual performance may vary and where the plotted film
sharpness is very close, the relative rankings might not be reflected
in actual film performance. Empirical observation suggests some of the
published curves may be pessimistic, especially for the older film
types.
|
|
Representative Slide and Print Film RMS
Grain
|
Sampling
Strategies:
Strategy A: Nyquist
(pixel
width ≤ 0.5 ∗ RMS Grain)
Strategy B: Pixel as
integrator
(pixel width
≥ 2 * RMS Grain) |
Film
Medium
|
RMS
Grain
Size
|
Strategy A [PPI]
|
Strategy B [PPI] |
Notes
|
Kodachrome
25
|
9
-
11
|
≥4800
|
≤1200 |
S
|
Ektachrome
64
|
11
|
≥4800 |
≤1200 |
S
|
Fuji
Provia
100F
|
8
|
≥6400
|
≤1600
|
S
|
| Fuji
NPC
160 |
4 |
≥12800
|
≤3200
|
P |
Fuji
Pro
160S/C
|
3
|
≥16000
|
≤4000
|
P
/
C
|
Ektar
Pro
100
|
<3
|
≥16000
|
≤4000 |
P
|
|
Representative Scanner Resolution
Performance
|
Scanner
Type
|
120/220
|
135
|
Resolution
Limit
[PPI]
|
Colour Resolution [bits]
|
Notes
|
| Kodak
IQSmart/EverSmart |
Y |
Y |
5,600 |
16.0
RGB |
|
| Kodak
HR500 |
Y |
Y |
5,600
(CCD
6,000)
|
-
|
|
Nikon
Coolscan
LS-5000ED
|
N
|
Y
|
4,000
|
14.0
RGB
|
|
| Nikon
Coolscan
LS-8000ED |
Y |
Y |
4,000 |
14.0
RGB |
|
| Nikon
Coolscan
LS-9000ED |
Y |
Y |
4,000 |
16.0
RGB |
|
Noritsu
HS-1800
|
Y |
Y |
2,000
|
-
|
|
Fuji
Frontier
SP-3000
|
Y |
Y |
1,700/120,
3850/135
|
-
|
|
|
|
Representative Imagery Examples
|
PC-9/A
aircraft
scanned
to
1200
PPI
/
5.8
Megapixels
from
a
120 / 645 frame of
Fuji SHGII 100 film, cropped and reduced to 768 pixel width. Note
the prop spinner (Mamiya 645/1000S).
|
|
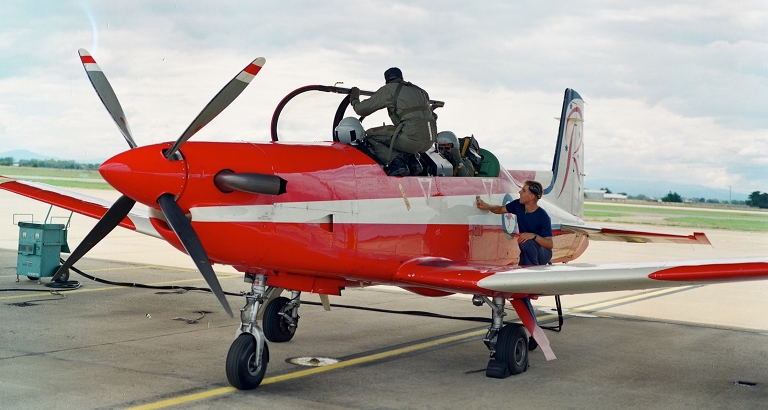
PC-9/A
aircraft
imaged
by
Bayer
pattern
CCD
digital
camera
at
5.1
Megapixels
(below) and 8.0 Megapixels (above), and reduced to 768 pixel width
(Fuji S5600 and S5800).
|
|
Ford F-100 Pickup, 1953, and Ford Mustang Fastback,
1966, shot with a Mamiya 645/1000S using Fuji Provia 100F and NPC 160,
and scanned using a Fuji Frontier SP-3000.
|
|
Banksia
integrifolia
or
Coast
Banksia
(below)
and
Eucalyptus
caesia
or
Silver
Princess
(above) imaged using a Fuji S5800 and HS10 respectively. Note
the lack of sharpness in the red eucalypt blossoms, compared to the
leaves.
|
|


