Extract hessian from gaussian formchk
11th of January, 2017
Here's a simple python (2.7) script that extracts a hessian from a formchk file from gaussian: hessian_g09. An example formchk file is here, and the expected output is here.
Usage: hessian_g09 my.fchk output.hess
The output hessian is a flat table which is formatted to be identical to that from nwchem. This way it can be processed using the nwhess.m Octave script below.
Octave tool for
computing vibrational frequencies from an NWChem Hessian
3rd of June, 2016
This tool can take a hessian matrix from NWChem and compute frequencies. It's an octave version of the Fortran code used in this article: Calcium-isotope fractionation between solution and solids with six, seven or eight oxygens bound to Ca(II). Download here: nwhess.m.
Example input files for water: input.hess (output from nwchem calculation with two imaginary freqs), and input.mass (hand-crafted input file with number of atoms, and corresponding isotope masses).
Example usage: start octave, then do
frequencies=nwhess("input.hess", "input.mass")
Python tool for
computing EFG (solid state NMR) properties from gaussian 09 output
3rd of June, 2016
This python (2.7) script takes a gaussian 09 output (log file) where the electrical field gradients have been calculated using the prop=efg statement. Download scripts here: efgparse_g09. Download example g09 output here: g09.g09out.
Run as:
efparse_g09 g09.g09out water
which gives you a .data and a .xyz file.
The output looks like this (I've made it tiny so it fits -- select and paste in gedit/notepad to see better):
 Atom                  X                   Y               Z               Q        Tensor 1        Tensor 2        Tensor 3            v_zz             eta       QCC (MHz)
O               0.00000             0.04177         0.00000        -0.02558        -1.53416        -0.17651         1.71067         1.71067         0.79364        10.28184
H               0.75899             0.63152         0.00000         0.00286        -0.48853         0.21315         0.27538        -0.48853         0.12737         0.32829
H              -0.75899             0.63152         0.00000         0.00286        -0.48853         0.21315         0.27538        -0.48853         0.12737         0.32829
Nudge-Elastic Band interpolation
tool
3rd of June, 2016
This takes a multi-xyz file as input and interpolates the atom positions. If you had two structures in the file, you'll get three (the average of the two). If you had three, you'll get five. If you had five, you'll get nine. It's useful for generating input for nudge-elastic band computations in e.g. nwchem. Download at nebinterpolate.py. Example input at test_input.xyz.
Usage:
nebinterpolate.py -i test_input.xyz -o test_output.xyz
Autorotate script
3rd of June, 2016
This is a python script that can take two similar molecules and put them into the same coordinate system so that they overlap. This is useful if you want to use the NEB interpolation script above or need input for NEB/QST scans but the molecules are rotated relative to one another (for example by gaussian when using autosym). You give the xyz coordinate files for the two molecules, and at least four atoms that the same in both molecules. The script then atempts to make those four(+) atoms overlap in the rotated structure.
See the script itself for documentation: autorotate.py. Example input at a.xyz and b.xyz
Usage:
autorotate.py a.xyz b.xyz '1,2,3,4'
This gives you a.rot.xyz
Generate all bonds,
angles, dihedrals
3rd of June, 2016
Extract all bonds and/or angles and/or dihedrals for a molecule. Useful for quick automated comparisons between molecular structures (e.g. optimised with different functionals/basis sets). Download: genstruc
Usage:
genstruc molecule.xyz 0.25 1
where 0.25 is the cutoff (max bond distance) in nm. The last number (here 1) indicates whether to generate bonds (1), angles (2) or dihedrals (3).
Track an MD run
3rd of June, 2016
If you're doing a long MD run to catch rare events, this script will extract a property (bond distance, angle or dihedral) from a multi-xyz file which allow you pinpoit when it happens. It's hardwired to only extract bond distances, but by changing lines 250-254 you can easily use it for angles and dihedrals. Download: pair_xyz
Usage:
pair_xyz input.xyz atom1 atom2
where atom1 and atom2 are the numerical positions in the xyz file.
Various python 2.7 scripts for
structure/spectral data extraction from nwchem and gaussian computations
3rd of June, 2016
pes_parse_g09 and qst_parse_g09 can extract intermediate structures from a Potential Energy surface Scan and a Quasi-synchronous transition state scan, respectively, from a g09 log file. The pes_parse_g09 script can also extract the final structure (only) from a regular geometry optimisation, whereas the qst_parse_g09 script would extract all the intermediate structures too.
Usage:
pes_pars_g09 g09.g09out
pes_parse and qst_parse do the same with nwchem output.
g09freq and g09raman do the same with g09 IR and Raman ouput.
Usage:
g09freq g09.g09out spectrum.dat
z-inversion script
3rd of June, 2016
This is a python script that inverts a molecule along the z-axis. It's a quick way of getting an enantiomer.
Download: flip_xyz.py.
Usage:
flip_xyz.py molecule.xyz
Tidy up an xyz file
3rd of June, 2016
Nothing fancy. It takes a messy .xyz file (e.g. with the wrong number of spaces between columns) and generates an xyz file that adheres to the formal specifications. Most programs are pretty forgiving with xyz files -- but not all of them are. This script is meant for the latter type of programs. Download: polish_xyz.py. Example input: messy.xyz
Usage:
polish_xyz.py messy.xyz tidy.xyz
Python tool for
importing nwchem-style basis sets into ECCE
21th of June, 2013
This tool tries to automate (although not completely) the import of new basis sets into ECCE. The git repository comes with instructions. See sourceforge.net/projects/nwbas2ecce/.
The source is written in python 2.x, and will run on any OS with minor modifications (mainly removing the '#!/usr/bin/python' line in the code). Note that eccepag was reverse engineered without access to specifications, and has only been validated on a handful of examples.
Python script for
conversion of GRAMS APS ascii files to tab-separated dat files
21th of June, 2013
This is a simple python script to convert the GRAMS ASP ascii output from Agilent Cary 630 FTIR to something that's actually useful. Download here: asp2asc.
You'll need python 2.x installed, and if you are using anything other than linux you will need to remove the first line of the script. Executing the file without arguments gives you access to help and instructions.
Python script for
computation of isotopic patterns/envelopes (for mass spectrometry)
21th of December, 2012
The isotopic pattern simulator has undergone a lot of recent development and is now maintained at sourceforge.net/p/pyisocalc.
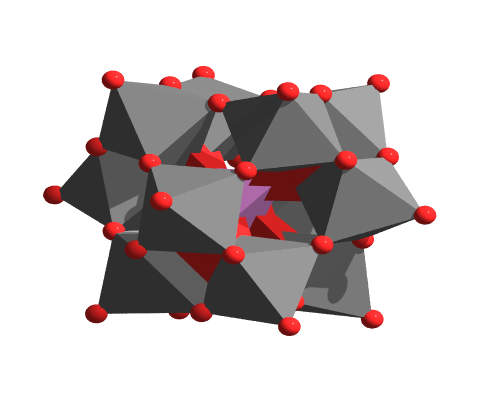
 Figure: W6O16-2
Octave (matlab) scripts for
NMR processing
19th of December, 2012
To generate the parameter file and the ascii fid from bruker binary fid and acqus, use bin2ascii and getpars (work under linux only and require sed, gawk, od). The usage of the scripts are described as comments in the scripts themselves, but a general workflow would be e.g.:
bin2ascii myepxt/1 fid
getpars myexpt/1 my.par
And then in octave:
[fid,pars]=loadfid('fid.ascii','my.par');fid=zf(fid,pars);[test,phc1]=bruk2ana(fid,pars); spectrum=ft(test,pars);phased=apk(spectrum,0,phc1);pltspec(phased)
 Figure: Example
Updated version of pOCPCA
19th of December, 2012
pOCPCA is a collection of octave scripts controlled by newmain.m which can do: evolving factor analysis, orthogonal projection approach, pKa extraction and rate law fitting of large data sets, such as UV/VIs titration data, ESI-MS cone voltage data and so on. The best way to learn how to use the scripts is by looking at newmain.m. The biggest challenge is really constructing the data input: the input file should have the vector of change (e.g. time or pH) in the first column, and the static vector (e.g. wavelength) in the first row. The first row, first column position can be anything (e.g. 0) as it's just used for symmetry. The rest of the fields contain the data.
 Figure: Example
pOCPCA for matlab: mOCPCA
19th of December, 2012
On popular request (1 person) I've recast the latest version of pOCPCA so that it runs under matlab as well. The pOCPCA version runs better on octave than mOCPCA though. ominimize.m, onelder_mean_min.m, and oread_options.m are hackjobs, but they have worked well enough for my test cases.

Simulation script for NMR kinetics
7th of December, 2012
Here's a simple program for simulating exchange on the NMR time scale. It's not different from the HME based model in terms of outcome, but only in terms of implementation. Put the files in a directory, open octave there, and run 'twosite'. The real value of the scripts are that they are very easy to edit if you want e.g. multiple pulses, more species in equilibrium, or different rate laws.
 Figure: Example
Data analysis
(EFA/OPA, kinetics, pKa etc.)
7th of September, 2011
These GNU/Octave scripts (NOT Matlab!) do a whole lot of things - evolving factor analysis (efa), factor analysis using the orthogonal projection approach, fitting of UV/VIS pH titration data to a speciation model, fitting of kinetic data (e.g. stopped-flow) to a kinetic model etc. I haven't had time to write a how-to, and may never get around to it. The scripts are released according to the CRAPL license.
 Figure: Simple example fitting UV/VIS-titration data to extract pKas
- License
- newmain.m
- getdata.m
- baseline.m
- trimdata.m
- scale.m
- getpca.m
- efa.m
- pka.m
- pkares.m
- opa.m
- rtl.m
- model.m
- modres.m
- oparef.m
- mcr.m
- normalise.m
- altlsq.m
- plotresults.m
 Figure: Extracted kinetic traces from stopped-flow UV/VIS data
NMR processing
7th of September, 2011
Here's a new set of scripts for processing of 1D bruker NMR spectra. They are based on the earlier ones (see below), but have been rewritten to be more modular and do not rely on octave anymore. You do, however, need od (octal dump), gawk, python 2.6, numpy and matplotlib. These scripts will only work on POSIX systems.
- bbin2asc.sh: converts binary fid to ascii. Reads acqus too.
- bbin2asc.py: called by bbin2asc.sh
- emfid.sh: applies apodization (exponential multiplication)
- phspec.sh: phases the fid
- fftfid.sh: fft and fftshift
- plotspec.sh: plots the spectrum using matplotlib
- fid: binary bruker fid
- acqus: bruker acqus file
- readme: a very basic readme file
- full.sh: example of how to use the scripts. Call it with ./full.sh 64 20 230
Old stuff:
brukdig2ascSimple shell script for the conversion a binary 1D bruker nmr file to an ascii file. Uses cpio, gawk, sed and od
Invokes pynmr and makespec (see below). Those lines can be commented out.
Usage: brukdig2asc
pynmrUsage: pynmr sweepwidth timedomain centrefrequencyoffset basefrequency
makespecUsage: makespec
NMR and kinetic simulation
- vector model
20th of September, 2011
 The following two scripts simulate a very simple model spectrum of an arbritary number of uncoupled spins wich are in chemical equilibrium. It loosely follows P. Allard et al. (J.Mag. Res., 1997, 129, 19-29; J. Biomol. NMR, 2000, 18, 49-63).
General data processing
7th of September, 2011
The following scripts have only been tested under Debian testing (currently Wheezy; 64 bit version). They depend on a number of installed applications, including octave, octave-optim, od, gawk, sed and python (2.6).
rotateshell script which depends on gawk. Rotates an m times n tab-separated matrix
Usage: rotate filename
findpeaksPython (2.6) script which parses an xyyy.. tab-separated file and returns signal (y) with intensities larger than the supplied cutoff value.
Usage: findpeaks filename column cutoff
where the filename is the name of the file, the column is the column which to parse (numbering starts at 1, not 0), and the cutoff value is a floating point number.
homogenise.shVery simple shell script (bash) using gawk which harvests the first column of a series of xy tab-separated files ({0..20..10}.dat and {220..300..20}.dat) to a single file.
Usage: sh homogenise.sh > output.dat
makelist.pyPython (2.6) script. It is fairly specific in its purpose as it
- opens a tab-separated file generated by
homogenise.sh - collects all
unique numbers in the file - sorts them in descending order. These represent all possible x values for a system
- opens a series of files with names in the {0..200..10}.dat and {220..300..20}.dat ranges. These are xy tab-separated files.
- collects all the data corresponding to the
unique x values - Returns a matrix with the X and Y values
Usage: makelist.py filename
procms.shsh procms.sh
POVRAY images
1st of March, 2012
Here are some povray scripts and png images. Feel free to use them in talks, on your website etc. The polyhedral representations were generated using GDIS and the ball and stick using winortep.
 Script Script |
 Script Script |
 Script Script |
 Script Script |
 Script Script |
 Script Script |
 Script Script |
 Script Script |
 Script Script |
 Script Script |
 Script Script |
 Script Script |
 Script Script |
 Script Script |
 Script Script |
 Script Script |
 Script Script |
 Script Script |
 Script Script |
 Script Script |
 Script Script |
 Script Script |
 Script Script |
|